This presentation covers a static analysis tool Semgrep and how it can be leveraged to find different vulnerabilities in a variety of languages. We initially presented “Automated Bug Hunting with Semgrep” at a local event in San Diego. Due to the positive feedback, a video and similar presentation slides were created to help educate a larger audience of software developers and security professionals on the benefits of Semgrep and its automated source code analysis features. Enjoy!
Posts tagged #Vulnerability Analysis
Ghidra Plugin Development for Vulnerability Research - Part-1
Overview
On March 5th at the RSA security conference, the National Security Agency (NSA) released a reverse engineering tool called Ghidra. Similar to IDA Pro, Ghidra is a disassembler and decompiler with many powerful features (e.g., plugin support, graph views, cross references, syntax highlighting, etc.). Although Ghidra's plugin capabilities are powerful, there is little information published on its full capabilities. This blog post series will focus on Ghidra’s plugin development and how it can be used to help identify software vulnerabilities.
In our previous post, we leveraged IDA Pro’s plugin functionality to identify sinks (potentially vulnerable functions or programming syntax). We then improved upon this technique in our follow up blog post to identify inline strcpy calls and identified a buffer overflow in Microsoft Office. In this post, we will use similar techniques with Ghidra’s plugin feature to identify sinks in CoreFTPServer v1.2 build 505.
Ghidra Plugin Fundamentals
Before we begin, we recommend going through the example Ghidra plugin scripts and the front page of the API documentation to understand the basics of writing a plugin. (Help -> Ghidra API Help)

When a Ghidra plugin script runs, the current state of the program will be handled by the following five objects:
currentProgram: the active program
currentAddress: the address of the current cursor location in the tool
currentLocation: the program location of the current cursor location in the tool, or null if no program location exists
currentSelection: the current selection in the tool, or null if no selection exists
currentHighlight: the current highlight in the tool, or null if no highlight exists
It is important to note that Ghidra is written in Java, and its plugins can be written in Java or Jython. For the purposes of this post, we will be writing a plugin in Jython. There are three ways to use Ghidra’s Jython API:
Using Python IDE (similar to IDA Python console):

Loading a script from the script manager:

Headless - Using Ghidra without a GUI:

With an understanding of Ghidra plugin basics, we can now dive deeper into the source code by utilizing the script manager (Right Click on the script -> Edit with Basic Editor)

The example plugin scripts are located under /path_to_ghidra/Ghidra/Features/Python/ghidra_scripts. (In the script manager, these are located under Examples/Python/):

Ghidra Plugin Sink Detection
In order to detect sinks, we first have to create a list of sinks that can be utilized by our plugin. For the purpose of this post, we will target the sinks that are known to produce buffer overflow vulnerabilities. These sinks can be found in various write-ups, books, and publications.
Our plugin will first identify all function calls in a program and check against our list of sinks to filter out the targets. For each sink, we will identify all of their parent functions and called addresses. By the end of this process, we will have a plugin that can map the calling functions to sinks, and therefore identify sinks that could result in a buffer overflow.
Locating Function Calls
There are various methods to determine whether a program contains sinks. We will be focusing on the below methods, and will discuss each in detail in the following sections:
Linear Search - Iterate over the text section (executable section) of the binary and check the instruction operand against our predefined list of sinks.
Cross References (Xrefs) - Utilize Ghidra’s built in identification of cross references and query the cross references to sinks.
Linear Search
The first method of locating all function calls in a program is to do a sequential search. While this method may not be the ideal search technique, it is a great way of demonstrating some of the features in Ghidra’s API.
Using the below code, we can print out all instructions in our program:
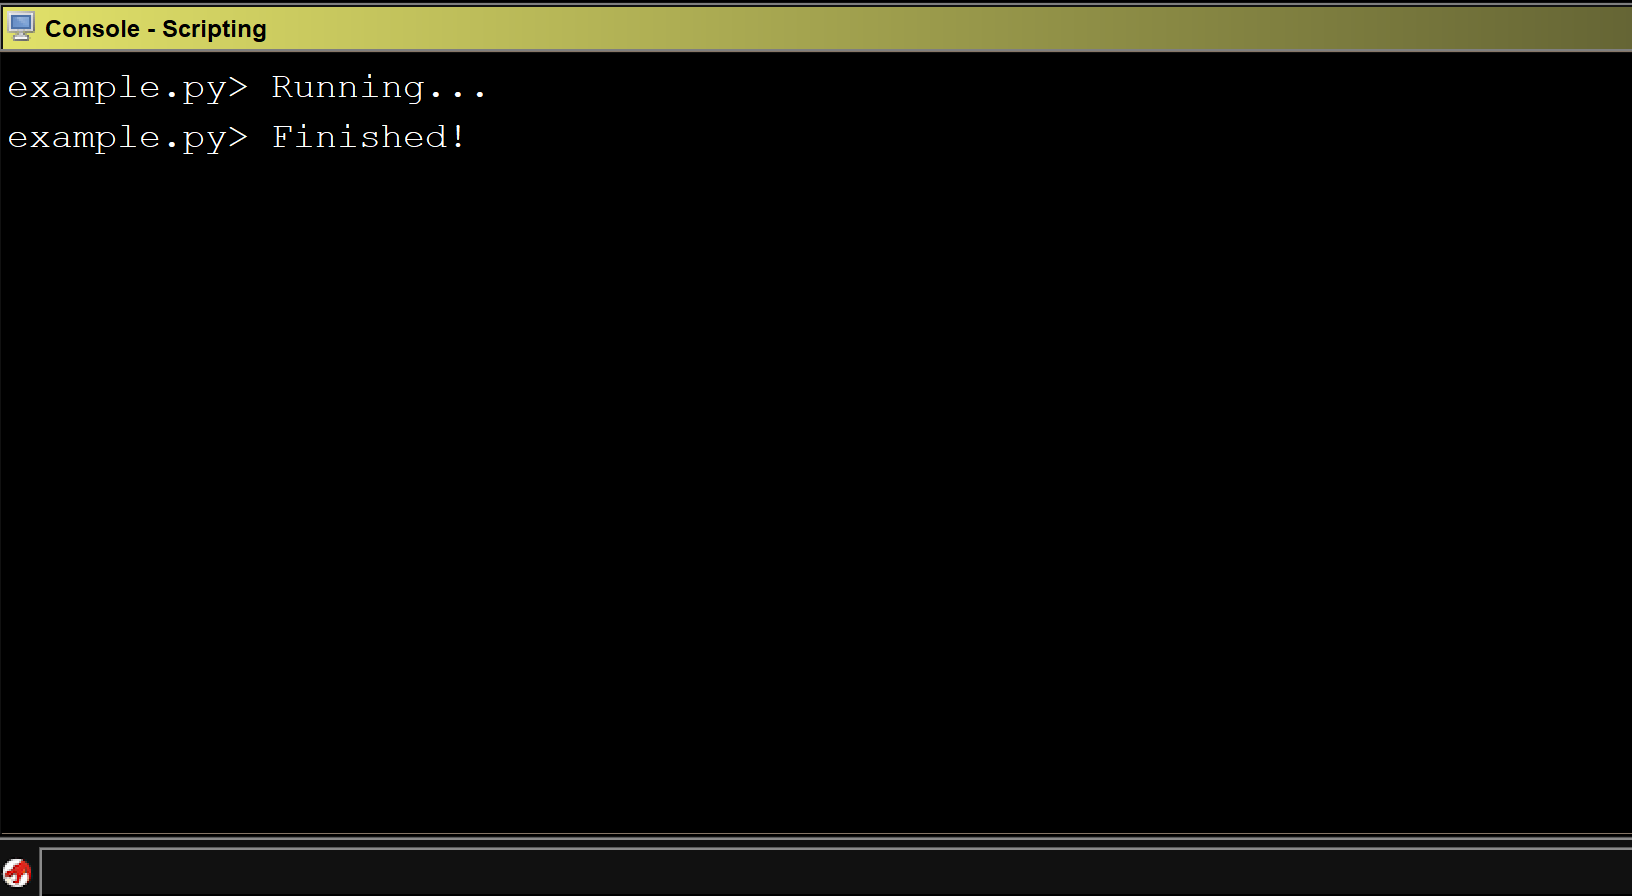
Running the above script on CoreFTPServer gives us the following output:

We can see that all of the x86 instructions in the program were printed out to the console.
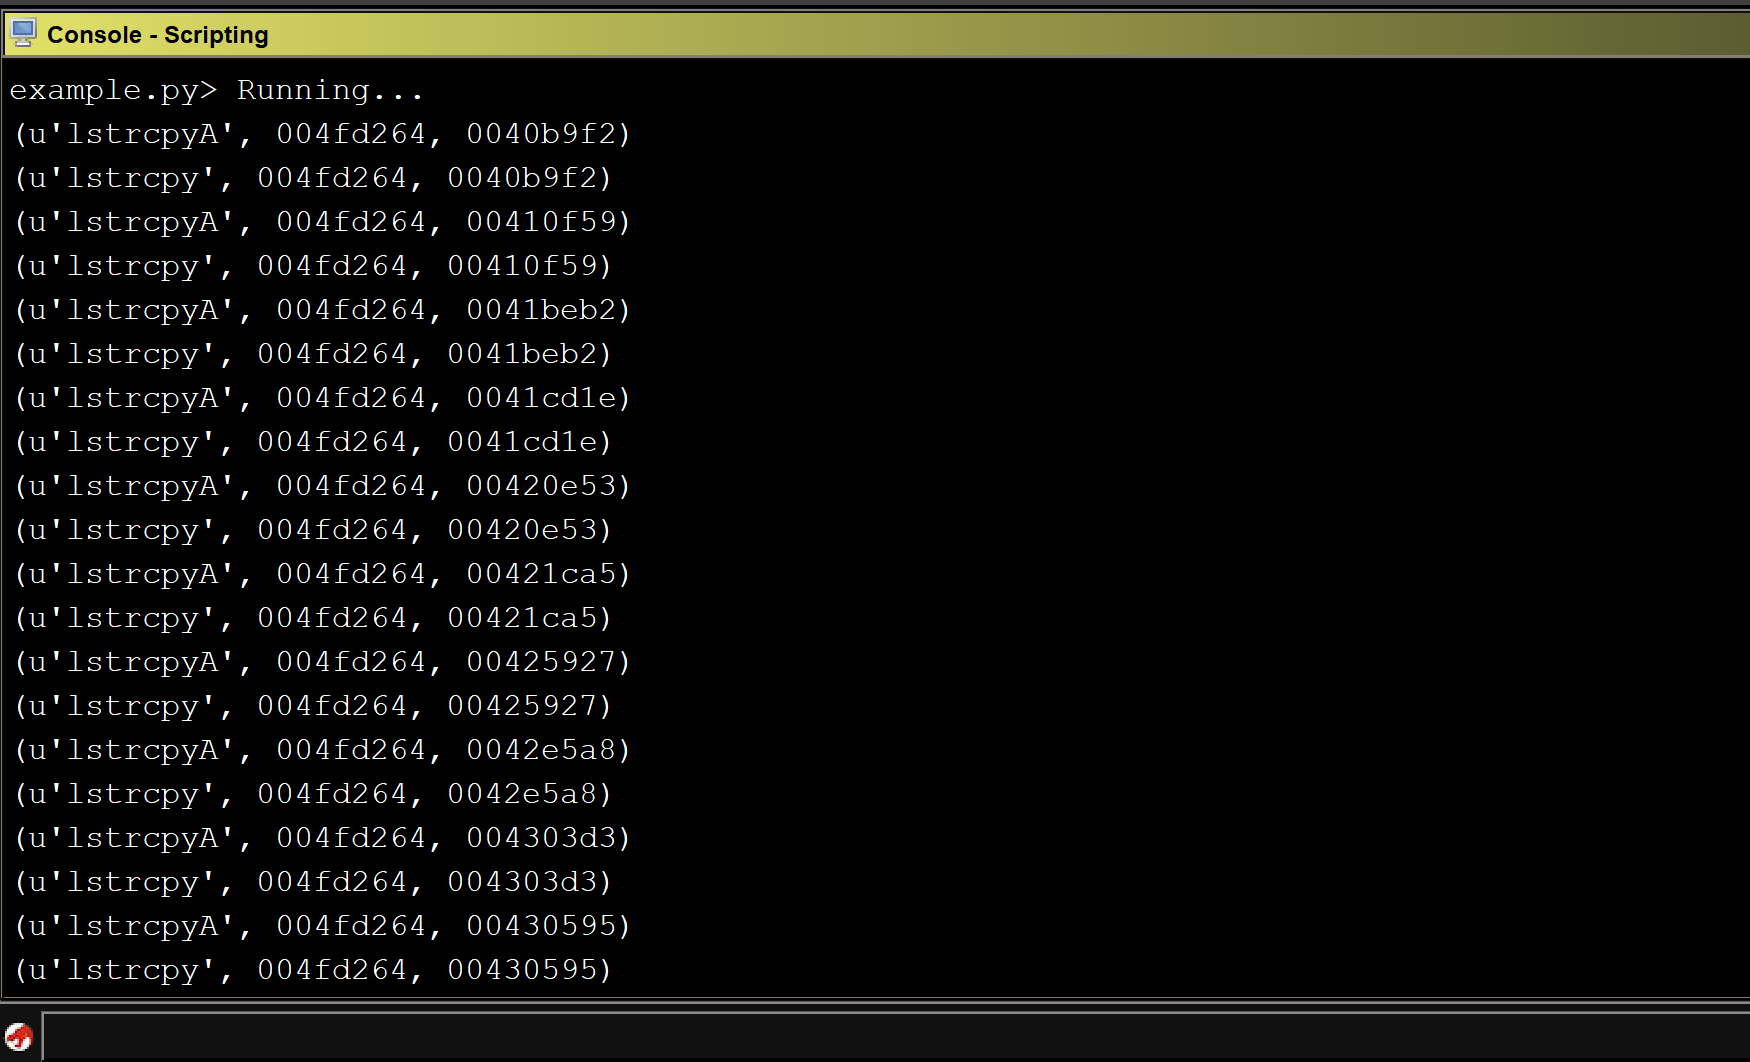
Next, we filter for sinks that are utilized in the program. It is important to check for duplicates as there could be multiple references to the identified sinks.
Building upon the previous code, we now have the following:
Now that we have identified a list of sinks in our target binary, we have to locate where these functions are getting called. Since we are iterating through the executable section of the binary and checking every operand against the list of sinks, all we have to do is add a filter for the call instruction.
Adding this check to the previous code gives us the following:
Running the above script against CoreFTPServer v1.2 build 505 shows the results for all detected sinks:
Unfortunately, the above code does not detect any sinks in the CoreFTPServer binary. However, we know that this particular version of CoreFTPServer is vulnerable to a buffer overflow and contains the lstrcpyA sink. So, why did our plugin fail to detect any sinks?
After researching this question, we discovered that in order to identify the functions that are calling out to an external DLL, we need to use the function manager that specifically handles the external functions.
To do this, we modified our code so that every time we see a call instruction we go through all external functions in our program and check them against the list of sinks. Then, if they are found in the list, we verify whether that the operand matches the address of the sink.
The following is the modified section of the script:
Running the modified script against our program shows that we identified multiple sinks that could result in a buffer overflow.

Xrefs
The second and more efficient approach is to identify cross references to each sink and check which cross references are calling the sinks in our list. Because this approach does not search through the entire text section, it is more efficient.
Using the below code, we can identify cross references to each sink:
Now that we have identified the cross references, we can get an instruction for each reference and add a filter for the call instruction. A final modification is added to include the use of the external function manager:
Running the modified script against CoreFTPServer gives us a list of sinks that could result in a buffer overflow:
Mapping Calling Functions to Sinks
So far, our Ghidra plugin can identify sinks. With this information, we can take it a step further by mapping the calling functions to the sinks. This allows security researchers to visualize the relationship between the sink and its incoming data. For the purpose of this post, we will use graphviz module to draw a graph.
Putting it all together gives us the following code:
Running the script against our program shows the following graph:

We can see the calling functions are highlighted in blue and the sink is highlighted in red. The addresses of the calling functions are displayed on the line pointing to the sink.
After conducting some manual analysis we were able to verify that several of the sinks identified by our Ghidra plugin produced a buffer overflow. The following screenshot of WinDBG shows that EIP is overwritten by 0x42424242 as a result of an lstrcpyA function call.

Additional Features
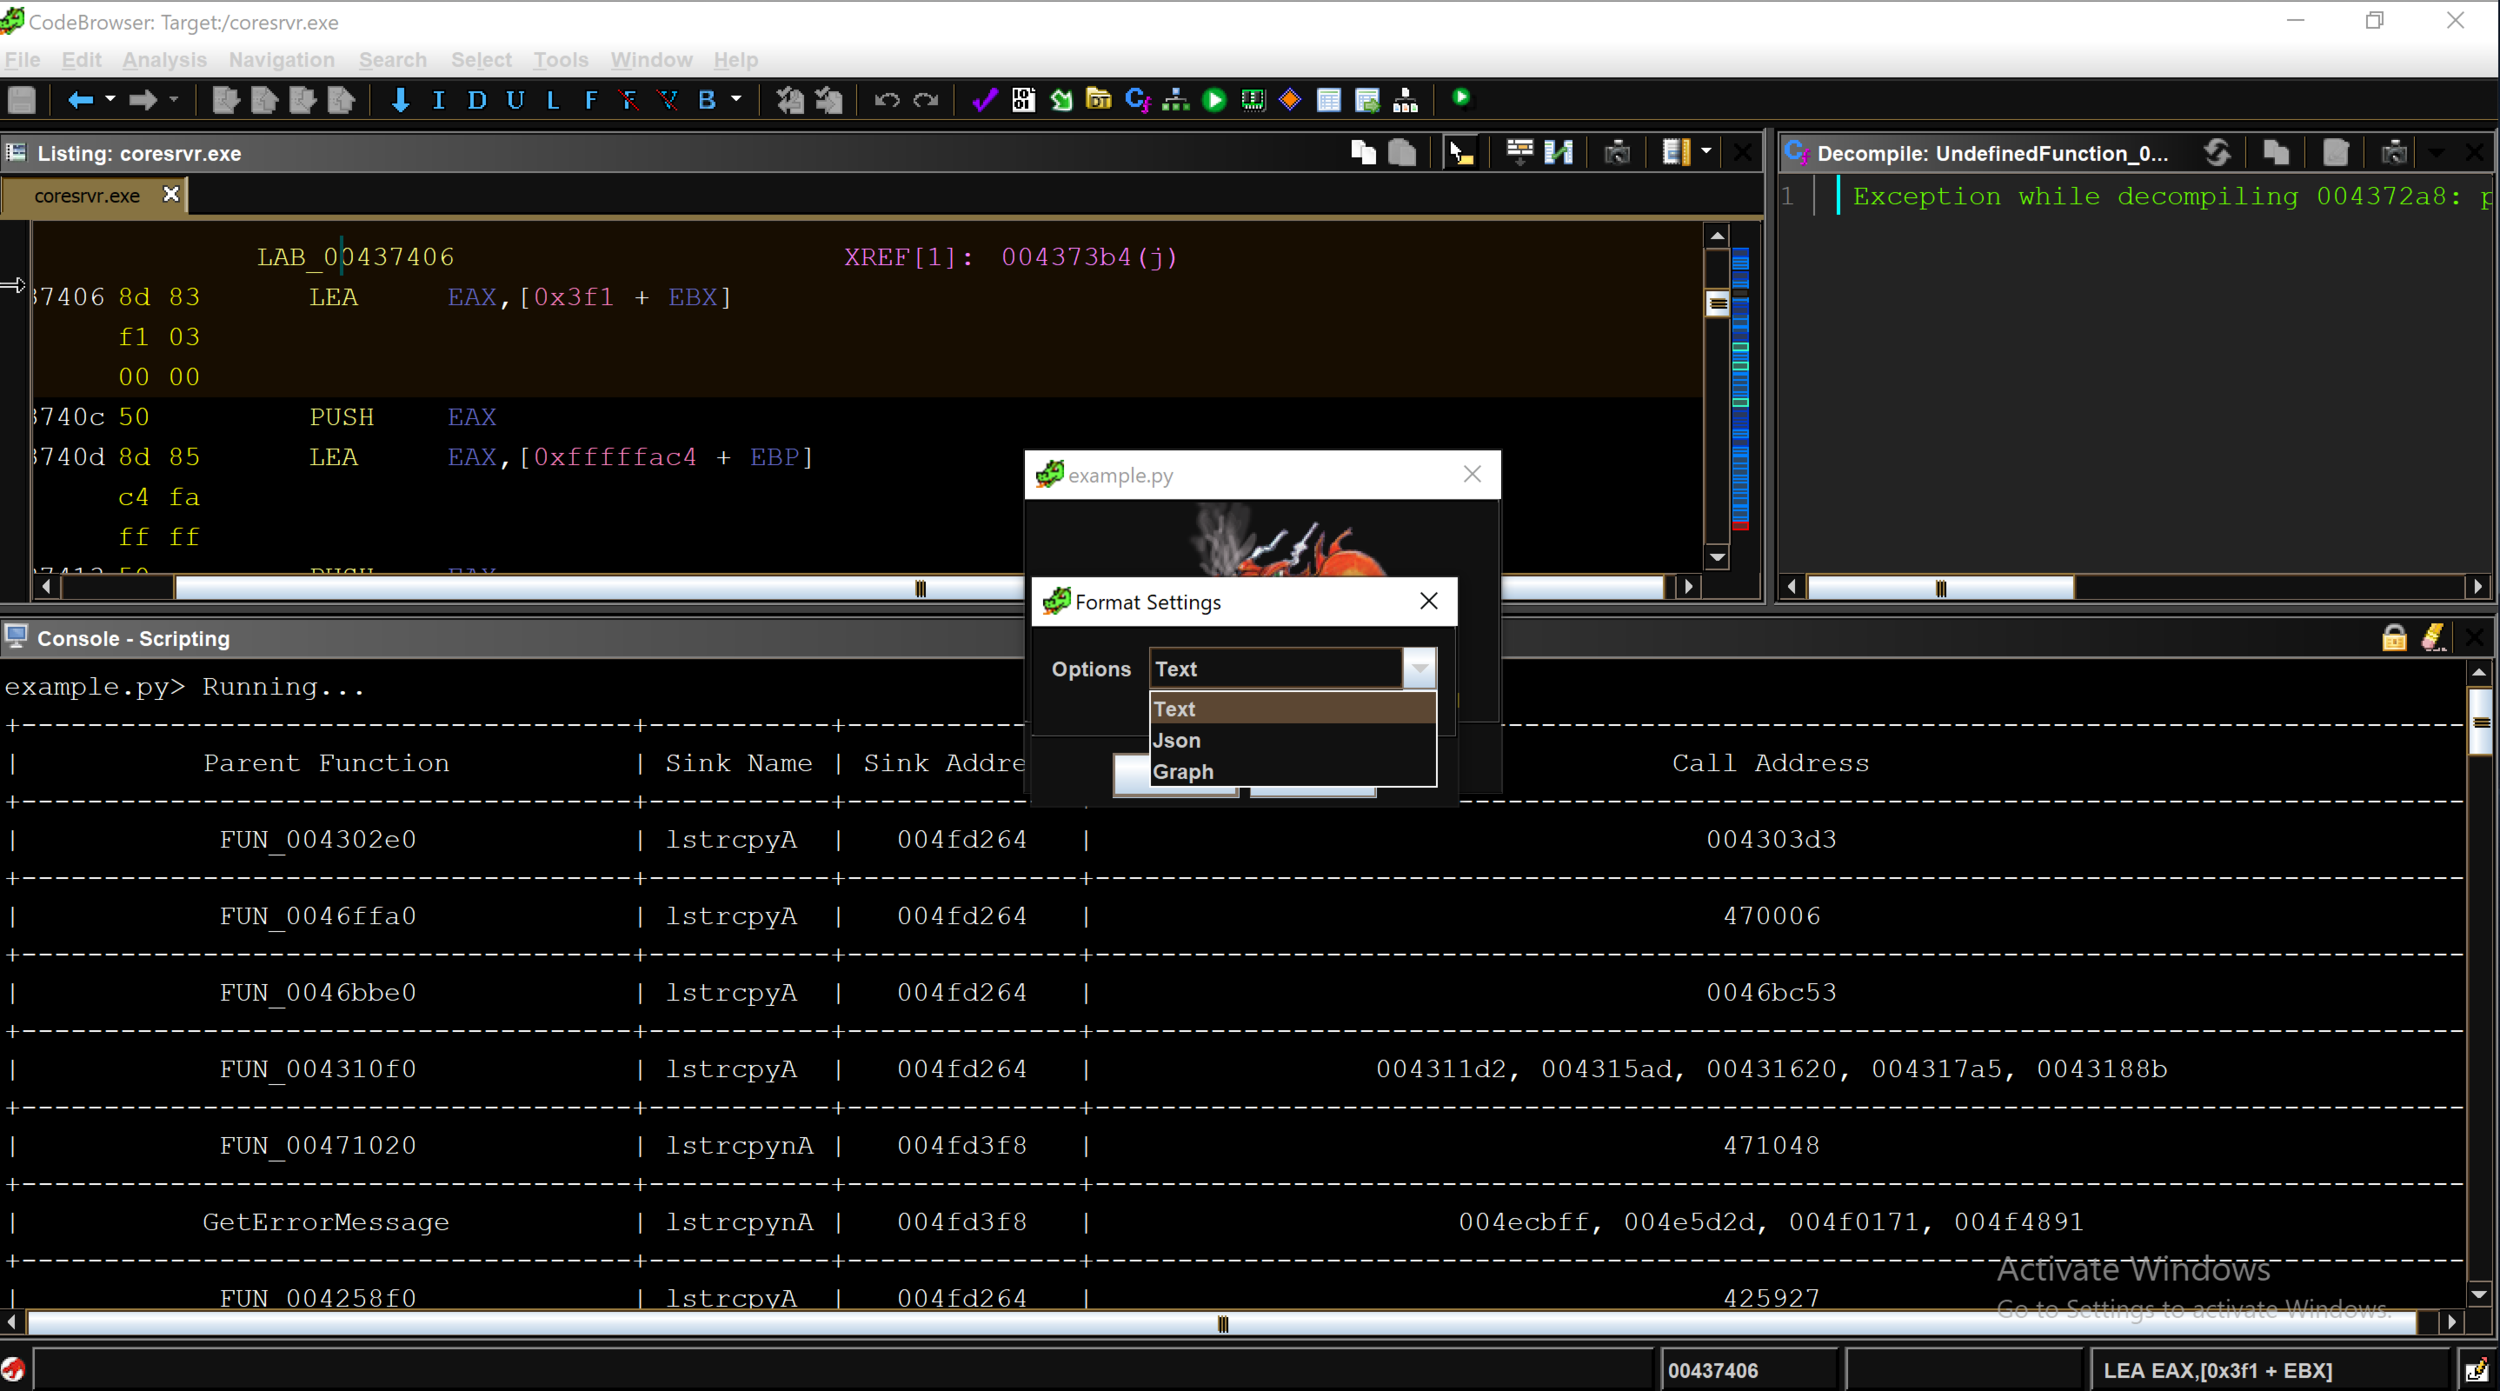
Although visualizing the result in a graph format is helpful for vulnerability analysis, it would also be useful if the user could choose different output formats.
The Ghidra API provides several methods for interacting with a user and several ways of outputting data. We can leverage the Ghidra API to allow a user to choose an output format (e.g. text, JSON, graph) and display the result in the chosen format. The example below shows the dropdown menu with three different display formats. The full script is available at our github:
Limitations
There are multiple known issues with Ghidra, and one of the biggest issues for writing an analysis plugin like ours is that the Ghidra API does not always return the correct address of an identified standard function.
Unlike IDA Pro, which has a database of function signatures (FLIRT signatures) from multiple libraries that can be used to detect the standard function calls, Ghidra only comes with a few export files (similar to signature files) for DLLs. Occasionally, the standard library detection will fail.
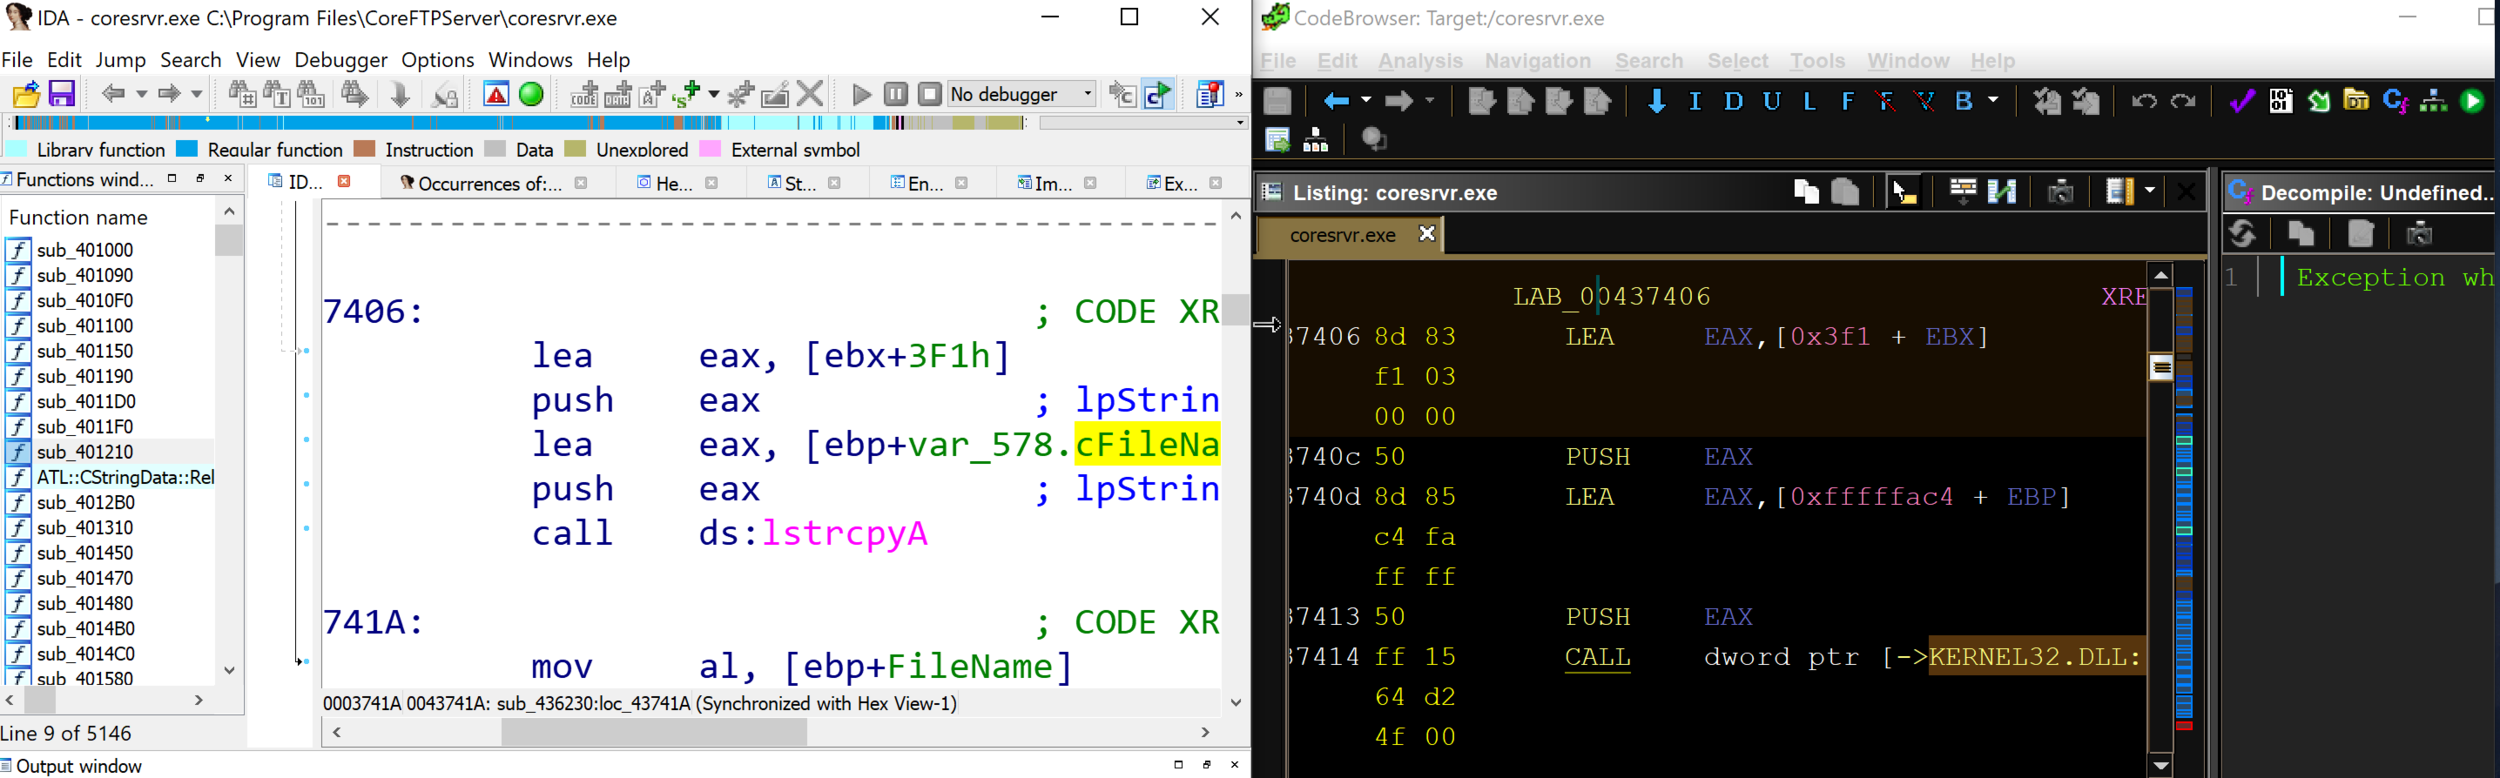
By comparing IDA Pro and Ghidra’s disassembly output of CoreFTPServer, we can see that IDA Pro’s analysis successfully identified and mapped the function lstrcpyA using a FLIRT signature, whereas Ghidra shows a call to the memory address of the function lstrcpyA.
Although the public release of Ghidra has limitations, we expect to see improvements that will enhance the standard library analysis and aid in automated vulnerability research.
Conclusion
Ghidra is a powerful reverse engineering tool that can be leveraged to identify potential vulnerabilities. Using Ghidra’s API, we were able to develop a plugin that identifies sinks and their parent functions and display the results in various formats. In our next blog post, we will conduct additional automated analysis using Ghidra and enhance the plugins vulnerability detection capabilities.
Introduction to IDAPython for Vulnerability Hunting
Overview
IDAPython is a powerful tool that can be used to automate tedious or complicated reverse engineering tasks. While much has been written about using IDAPython to simplify basic reversing tasks, little has been written about using IDAPython to assist in auditing binaries for vulnerabilities. Since this is not a new idea (Halvar Flake presented on automating vulnerability research with IDA scripting in 2001), it is a bit surprising that there is not more written on this topic. This may be partially a result of the increasing complexity required to perform exploitation on modern operating systems. However, there is still a lot of value in being able to automate portions of the vulnerability research process.
In this post we will begin to describe using basic IDAPython techniques to detect dangerous programming constructs which often result in stack-buffer overflows. Throughout this blog post, I will be walking through automating the detection of a basic stack-buffer overflow using the “ascii_easy” binary from http://pwnable.kr. While this binary is small enough to manually reverse in its entirety, it serves as a good educational example whereby the same IDAPython techniques can be applied to much larger and more complex binaries.
Getting Started
Before we start writing any IDAPython, we must first determine what we would like our scripts to look for. In this case, I have selected a binary with one of the most simple types of vulnerabilities, a stack-buffer overflow caused by using `strcpy` to copy a user-controlled string into a stack-buffer. Now that we know what we are looking for, we can begin to think about how to automate finding these types of vulnerabilities.
For our purposes here, we will break this down into two steps:
1. Locating all function calls that may cause the stack-buffer overflow (in this case `strcpy`)
2. Analyzing usages of function calls to determine whether a usage is “interesting” (likely to cause an exploitable overflow)
Locating Function Calls
In order to find all calls to the `strcpy` function, we must first locate the `strcpy` function itself. This is easy to do with the functionality provided by the IDAPython API. Using the code snippet below we can print all function names in the binary:
for functionAddr in Functions():
   print(GetFunctionName(functionAddr))
Running this IDAPython script on the ascii_easy binary gives us the following output. We can see that all of the function names were printed in the output window of IDA Pro.

Next, we add code to filter through the list of functions in order to find the `strcpy` function that is of interest to us. Using simple string comparisons will do the trick here. Since we oftentimes deal with functions that are similar, but slightly differing names (such as `strcpy` vs `_strcpy` in the example program) due to how imported functions are named, it is best to check for substrings rather than exact strings.
Building upon our previous snippet, we now have the following code:
for functionAddr in Functions():
    if “strcpy” in GetFunctionName(functionAddr):
        print hex(functionAddr)
Now that we have the function that we are interested in, we have to identify all locations where it is called. This involves a couple of steps. First we get all cross-references to `strcpy` and then we check each cross-reference to find which cross references are actual `strcpy` function calls. Putting this all together gives us the piece of code below:
for functionAddr in Functions():
    # Check each function to look for strcpy
    if "strcpy" in GetFunctionName(functionAddr):
        xrefs = CodeRefsTo(functionAddr, False)
        # Iterate over each cross-reference
        for xref in xrefs:
            # Check to see if this cross-reference is a function call
            if GetMnem(xref).lower() == "call":
                print hex(xref)
Running this against the ascii_easy binary yields all calls of `strcpy` in the binary. The result is shown below:

Analysis of Function Calls
Now, with the above code, we know how to get the addresses of all calls to `strcpy` in a program. While in the case of the ascii_easy application there is only a single call to `strcpy` (which also happens to be vulnerable), many applications will have a large number of calls to `strcpy` (with a large number not being vulnerable) so we need some way to analyze calls to `strcpy` in order to prioritize function calls that are more likely to be vulnerable.
One common feature of exploitable buffers overflows is that they oftentimes involve stack buffers. While exploiting buffer overflows in the heap and elsewhere is possible, stack-buffer overflows represent a simpler exploitation path.
This involves a bit of analysis of the destination argument to the strcpy function. We know that the destination argument is the first argument to the strcpy function and we are able to find this argument by going backwards through the disassembly from the function call. The disassembly of the call to strcpy is included below.

In analyzing the above code, there are two ways that one might find the destination argument to the _strcpy function. The first method would be to rely on the automatic IDA Pro analysis which automatically annotates known function arguments. As we can see in the above screenshot, IDA Pro has automatically detected the “dest” argument to the _strcpy function and has marked it as such with a comment at the instruction where the argument is pushed onto the stack.
Another simple way to detect arguments to the function would be to move backwards through the assembly, starting at the function call looking for “push” instructions. Each time we find an instruction, we can increment a counter until we locate the index of the argument that we are looking for. In this case, since we are looking for the “dest” argument that happens to be the first argument, this method would halt at the first instance of a “push” instruction prior to the function call.
In both of these cases, while we are traversing backwards through the code, we are forced to be careful to identify certain instructions that break sequential code flow. Instructions such as “ret” and “jmp” cause changes in the code flow that make it difficult to accurately identify the arguments. Additionally, we must also make sure that we don’t traverse backwards through the code past the start of the function that we are currently in. For now, we will simply work to identify instances of non-sequential code flow while searching for the arguments and halt the search if any instances of non-sequential code flow is found.
We will use the second method of finding arguments (looking for arguments being pushed to the stack). In order to assist us in finding arguments in this way, we should create a helper function. This function will work backwards from the address of a function call, tracking the arguments pushed to the stack and return the operand corresponding to our specified argument.
So for the above example of the call to _strcpy in ascii_easy, our helper function will return the value “eax” since the “eax” register stores the destination argument of strcpy when it is pushed to the stack as an argument to _strcpy. Using some basic python in conjunction with the IDAPython API, we are able to build a function that does that as shown below.
def find_arg(addr, arg_num):
   # Get the start address of the function that we are in
   function_head = GetFunctionAttr(addr, idc.FUNCATTR_START)
   steps = 0
   arg_count = 0
   # It is unlikely the arguments are 100 instructions away, include this as a safety check
   while steps < 100:
       steps = steps + 1
       # Get the previous instruction
       addr = idc.PrevHead(addr)
       # Get the name of the previous instruction
       op = GetMnem(addr).lower()
       # Check to ensure that we haven’t reached anything that breaks sequential code flow
       if op in ("ret", "retn", "jmp", "b") or addr < function_head:
           return
       if op == "push":
           arg_count = arg_count + 1
           if arg_count == arg_num:
               # Return the operand that was pushed to the stack
               return GetOpnd(addr, 0)
Using this helper function we are able to determine that the “eax” register was used to store the destination argument prior to calling _strcpy. In order to determine whether eax is pointing to a stack buffer when it is pushed to the stack we must now continue to try to track where the value in “eax” came from. In order to do this, we use a similar search loop to that which we used in our previous helper function:
# Assume _addr is the address of the call to _strcpy
# Assume opnd is “eax”
# Find the start address of the function that we are searching in
function_head = GetFunctionAttr(_addr, idc.FUNCATTR_START)
addr = _addr
while True:
   _addr = idc.PrevHead(_addr)
   _op = GetMnem(_addr).lower()
   if _op in ("ret", "retn", "jmp", "b") or _addr < function_head:
       break
   elif _op == "lea" and GetOpnd(_addr, 0) == opnd:
       # We found the destination buffer, check to see if it is in the stack
       if is_stack_buffer(_addr, 1):
           print "STACK BUFFER STRCOPY FOUND at 0x%X" % addr
           break
   # If we detect that the register that we are trying to locate comes from some other register
   # then we update our loop to begin looking for the source of the data in that other register
   elif _op == "mov" and GetOpnd(_addr, 0) == opnd:
       op_type = GetOpType(_addr, 1)
       if op_type == o_reg:
           opnd = GetOpnd(_addr, 1)
           addr = _addr
       else:
           break
In the above code we perform a backwards search through the assembly looking for instructions where the register that holds the destination buffer gets its value. The code also performs a number of other checks such as checking to ensure that we haven’t searched past the start of the function or hit any instructions that would cause a change in the code flow. The code also attempts to trace back the value of any other registers that may have been the source of the register that we were originally searching for. For example, this code attempts to account for the situation demonstrated below.
...
lea ebx [ebp-0x24]
...
mov eax, ebx
...
push eax
...
Additionally, in the above code, we reference the function is_stack_buffer(). This function is one of the last pieces of this script and something that is not defined in the IDA API. This is an additional helper function that we will write in order to assist us with our bug hunting. The purpose of this function is quite simple: given the address of an instruction and an index of an operand, report whether the variable is a stack buffer. While the IDA API doesn’t provide us with this functionality directly, it does provide us with the ability to check this through other means. Using the get_stkvar function and checking whether the result is None or an object, we are able to effectively check whether an operand is a stack variable. We can see our helper function in the code below:
def is_stack_buffer(addr, idx):
   inst = DecodeInstruction(addr)
   return get_stkvar(inst[idx], inst[idx].addr) != None
Note that the above helper function is not compatible with the IDA 7 API. In our next blog post we will present a new method of checking whether an argument is a stack buffer while maintaining compatibility with all recent versions of the IDA API.
So now we can put all of this together into a nice script as shown below in order to find all of the instances of strcpy being used in order to copy data into a stack buffer. With these skills it is possible for us to extend these capabilities beyond just strcpy but also to similar functions such as strcat, sprintf, etc. (see the Microsoft Banned Functions List for inspiration) as well as to adding additional analysis to our script. The script is included in its entirety at the bottom of the post. Running the script results in our successfully finding the vulnerable strcpy as shown below.

Script
def is_stack_buffer(addr, idx):
   inst = DecodeInstruction(addr)
   return get_stkvar(inst[idx], inst[idx].addr) != None

def find_arg(addr, arg_num):
   # Get the start address of the function that we are in
   function_head = GetFunctionAttr(addr, idc.FUNCATTR_START)
   steps = 0
   arg_count = 0
   # It is unlikely the arguments are 100 instructions away, include this as a safety check
   while steps < 100:
       steps = steps + 1
       # Get the previous instruction
       addr = idc.PrevHead(addr)
       # Get the name of the previous instruction
       op = GetMnem(addr).lower()
       # Check to ensure that we havent reached anything that breaks sequential code flow
       if op in ("ret", "retn", "jmp", "b") or addr < function_head:
           return
       if op == "push":
           arg_count = arg_count + 1
           if arg_count == arg_num:
               #Return the operand that was pushed to the stack
               return GetOpnd(addr, 0)

for functionAddr in Functions():
   # Check each function to look for strcpy
   if "strcpy" in GetFunctionName(functionAddr):
       xrefs = CodeRefsTo(functionAddr, False)
       # Iterate over each cross-reference
       for xref in xrefs:
           # Check to see if this cross-reference is a function call
           if GetMnem(xref).lower() == "call":
               # Since the dest is the first argument of strcpy
               opnd = find_arg(xref, 1)
               function_head = GetFunctionAttr(xref, idc.FUNCATTR_START)
               addr = xref
               _addr = xref
               while True:
                   _addr = idc.PrevHead(_addr)
                   _op = GetMnem(_addr).lower()
                   if _op in ("ret", "retn", "jmp", "b") or _addr < function_head:
                       break
                   elif _op == "lea" and GetOpnd(_addr, 0) == opnd:
                       # We found the destination buffer, check to see if it is in the stack
                       if is_stack_buffer(_addr, 1):
                           print "STACK BUFFER STRCOPY FOUND at 0x%X" % addr                            break
                   # If we detect that the register that we are trying to locate comes from some other register
                   # then we update our loop to begin looking for the source of the data in that other register
                   elif _op == "mov" and GetOpnd(_addr, 0) == opnd:
                       op_type = GetOpType(_addr, 1)
                       if op_type == o_reg:
                           opnd = GetOpnd(_addr, 1)
                           addr = _addr
                       else:
                           break
Full Script Posted at: https://github.com/Somerset-Recon/blog/blob/master/into_vr_script.py